About


GeViewer is a lightweight, Python-based visualization tool for Geant4. It provides a convenient way to check detector geometries, view events, and produce publication-quality visuals, without the hassle of setting up OpenGL or installing outdated software.
Features
Physics-focused visuals: See color-coded particle trajectories and hits in a 3D-rendered detector
Intuitive controls: Use your mouse to rotate, zoom, pan, and interact with the geometry
Customizable viewing: Choose the viewing perspective, rendering style, and background for optimal visibility
High-quality graphics: Produce publication-quality visuals of detectors and events
Geometry inspection: Check for overlaps, measure distances, and toggle visibility component-by-component
Fast performance: Enjoy smooth, responsive rendering even with large and complex detector geometries
User Interface
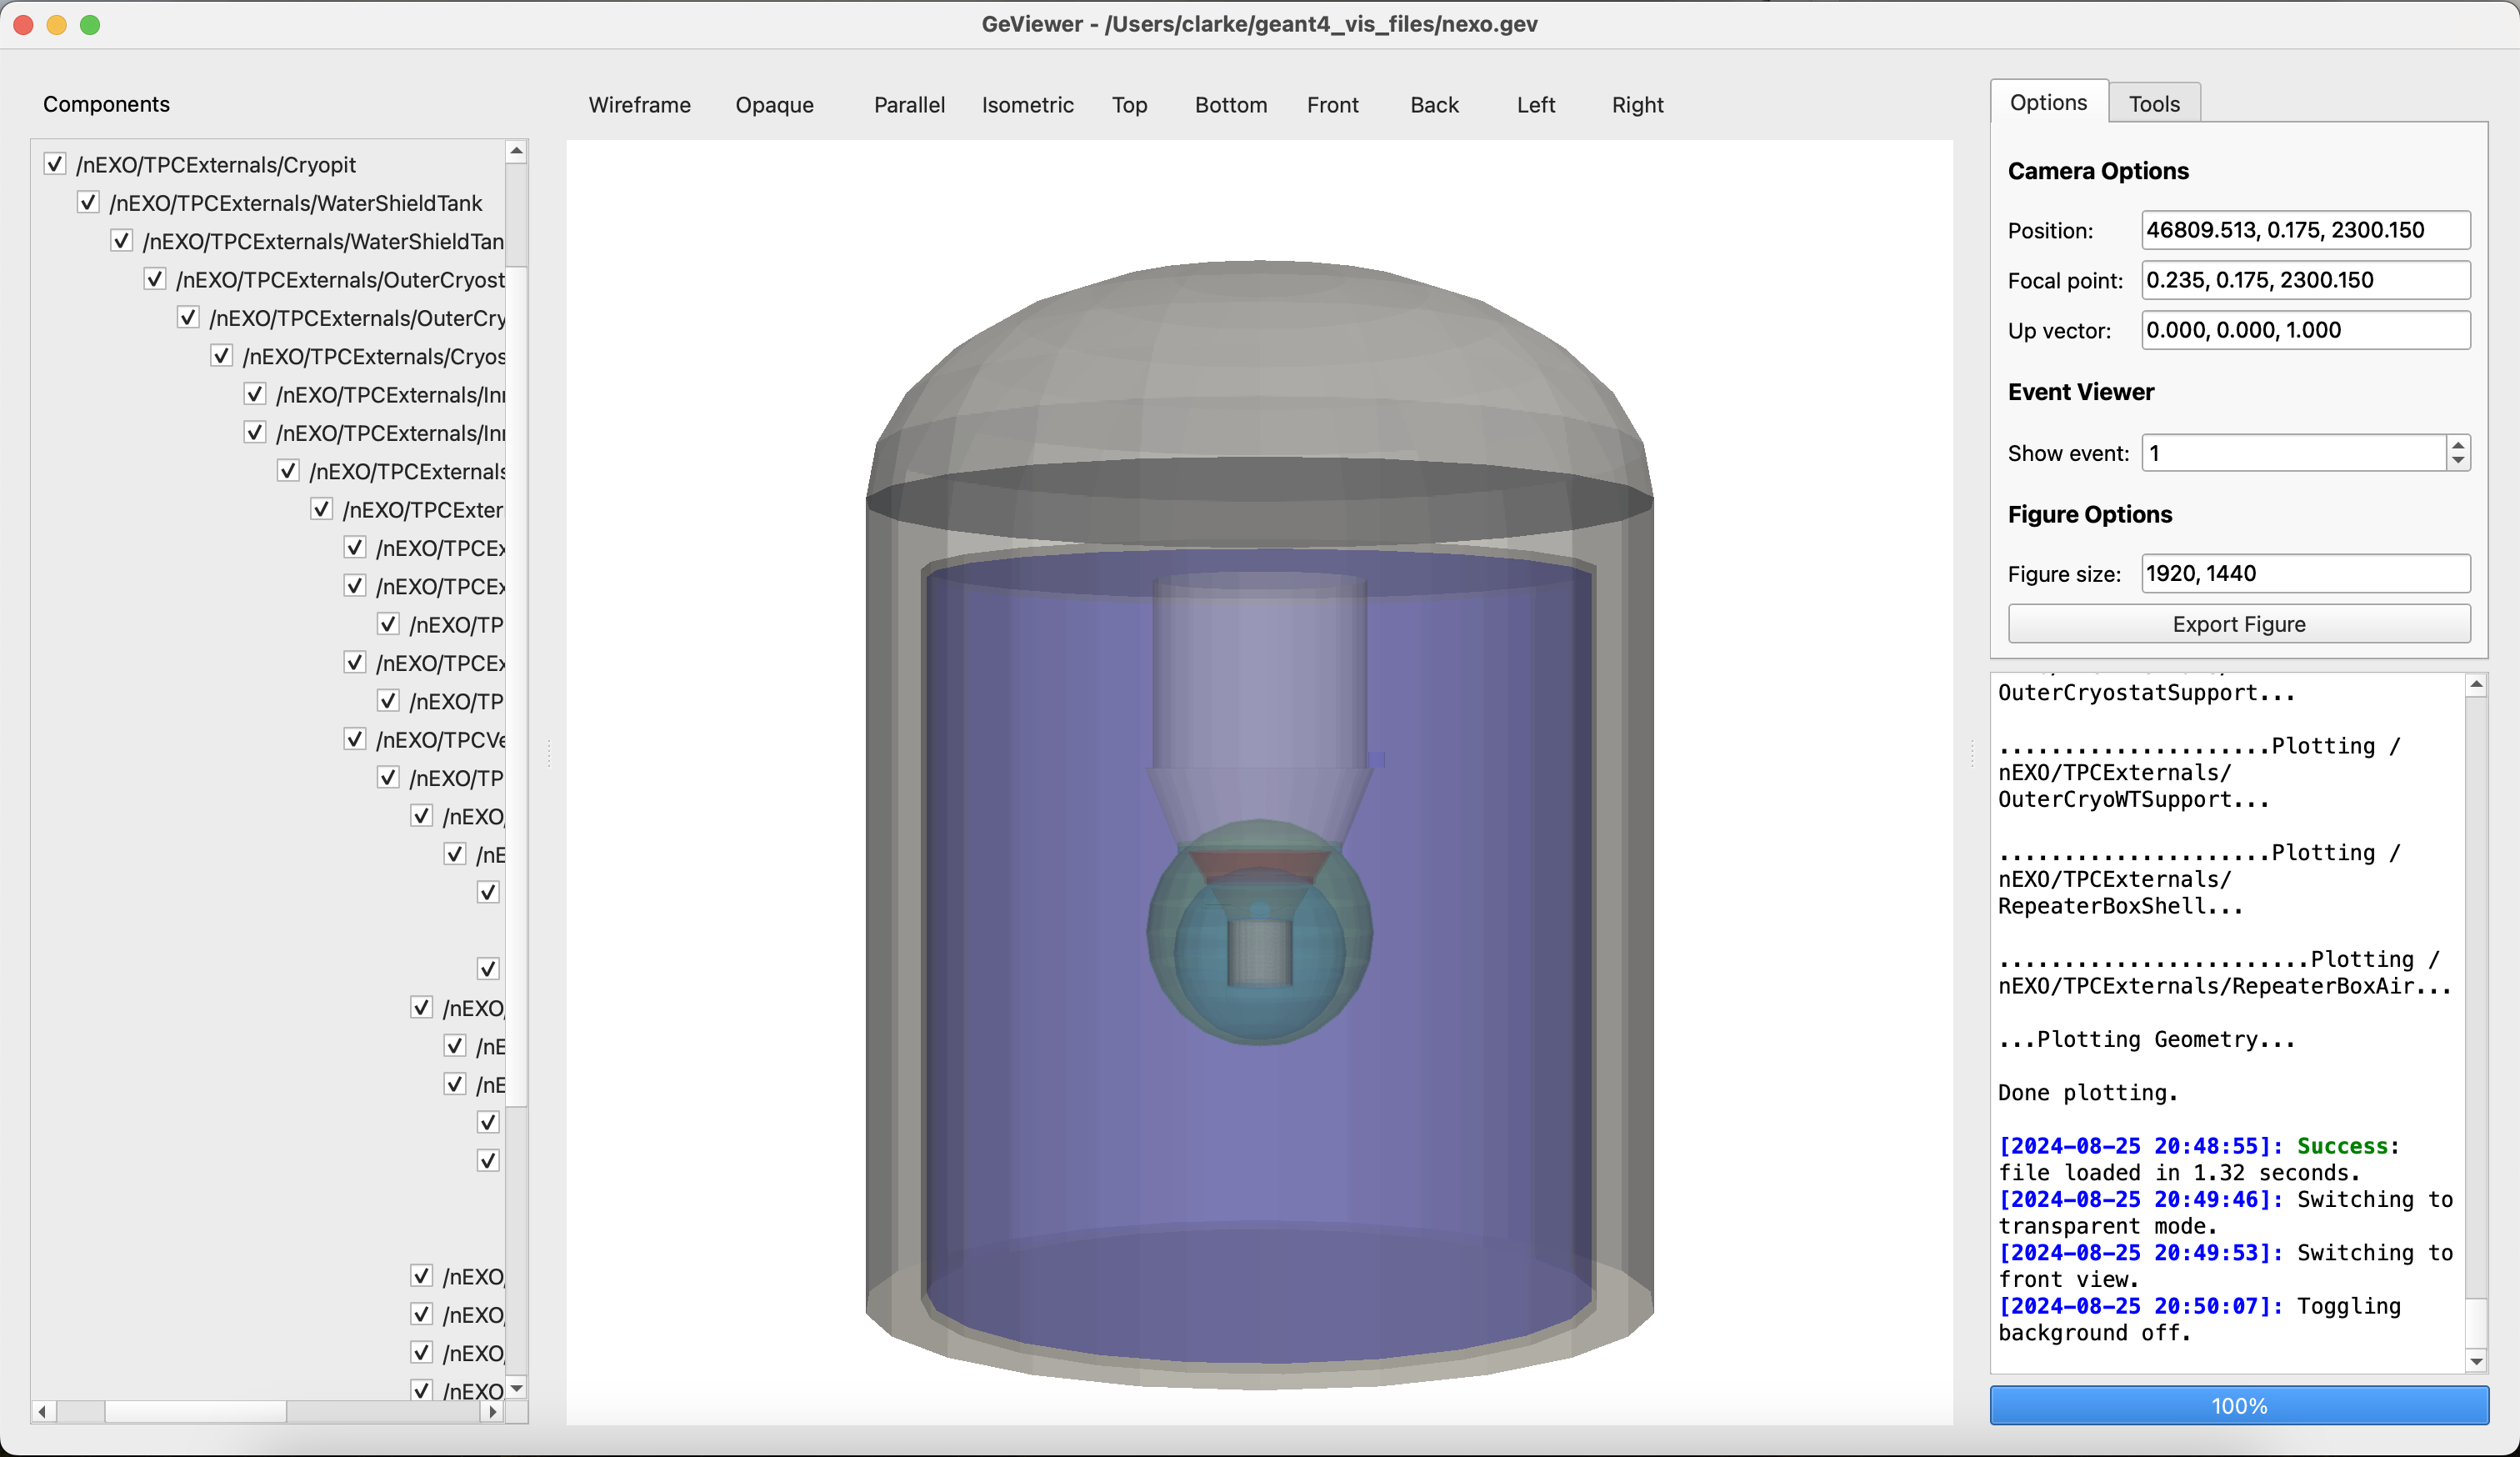
The GeViewer UI in light mode with transparency enabled
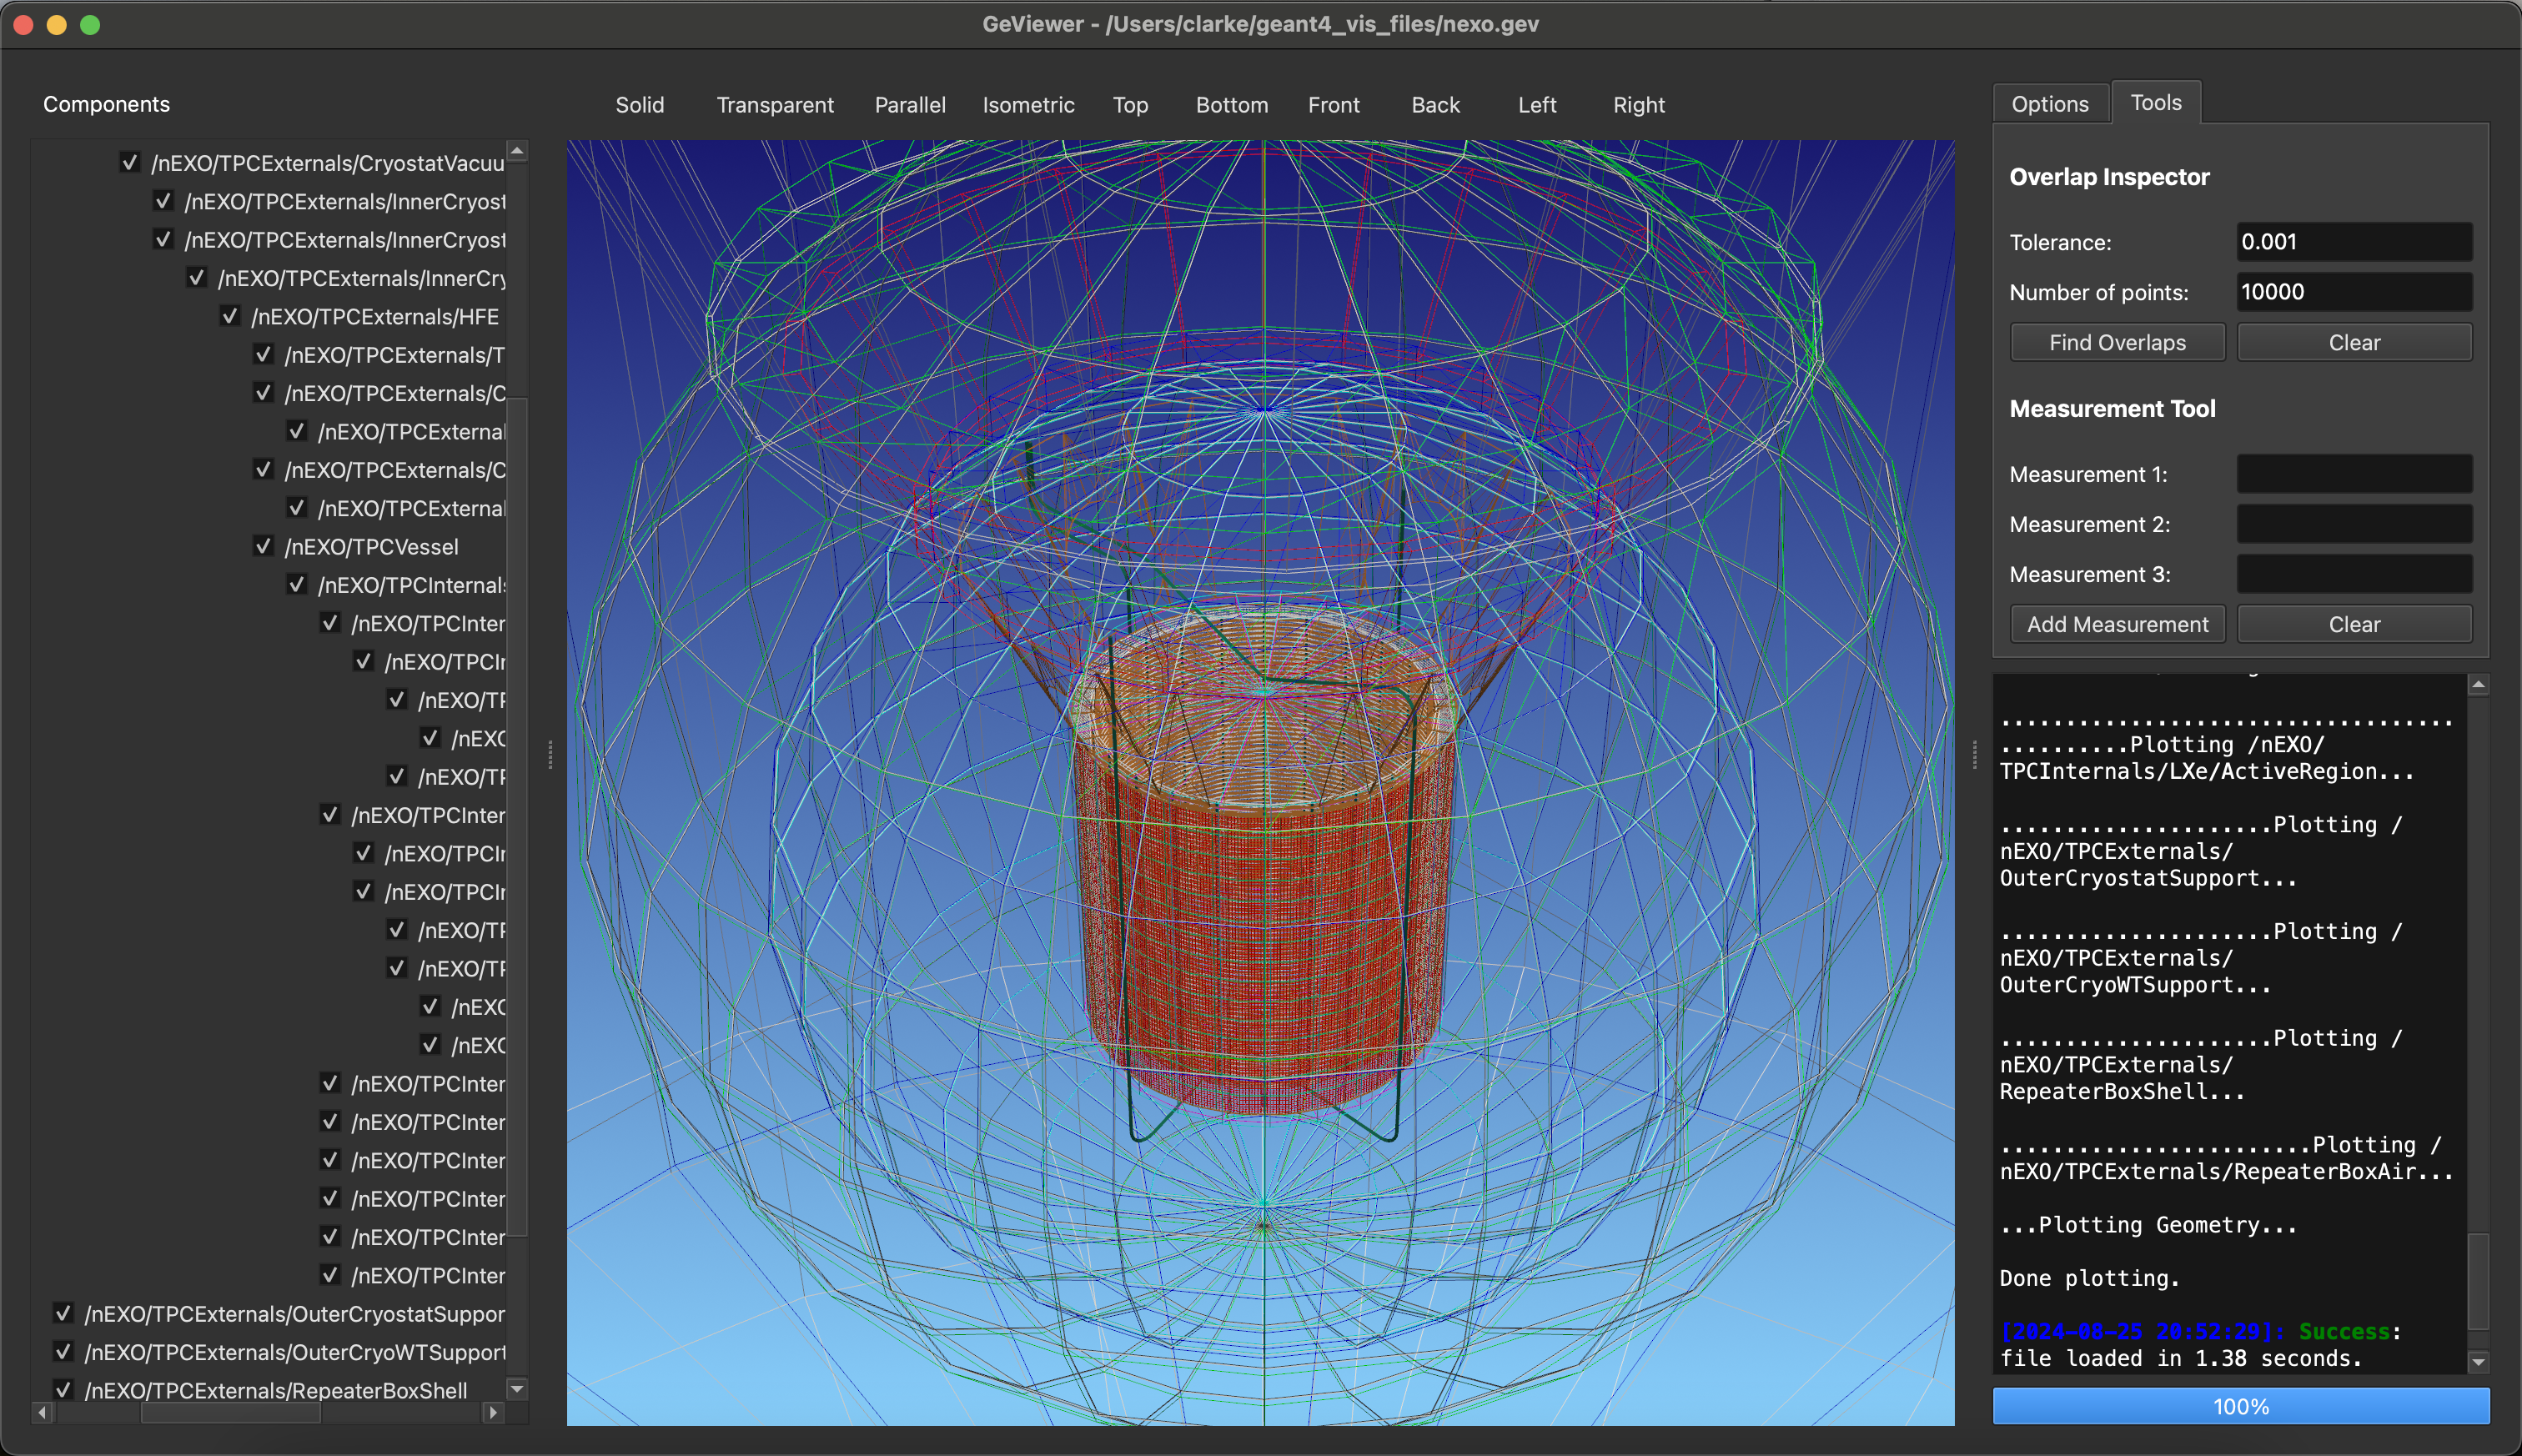
The GeViewer UI in dark mode with wireframe rendering enabled