Usage
Quick Start
Following installation, you can launch GeViewer from the command line:
geviewer
This will open a new window where you can then load files to view. Alternatively, you can provide a list of files to load from the command line:
geviewer /path/to/file1.heprep /path/to/file2.wrl
The next section describes how to produce files that can be read by GeViewer using Geant4.
Instructions for Geant4
To produce Geant4 outputs that can be read by GeViewer, you must tell Geant4 to save the visualization either as a HepRep file or a VRML file. HepRep files are preferred, as they allow you to turn on or off components or events individually. You can do this by putting the following in your macro file:
# this line should come BEFORE the /run/beamOn command
/vis/open HepRepFile
# you can also use /vis/open VRML2FILE
Following this, you can add the geometry, trajectories, and step markers. Any of these can be omitted if they are not needed, but note that without first adding trajectories, step markers will not be visible.
# now ensure that the geometry is displayed
/vis/drawVolume

# add the trajectories
/vis/scene/add/trajectories

# add the step markers
/vis/modeling/trajectories/create/drawByParticleID
/vis/modeling/trajectories/drawByParticleID-0/default/setDrawStepPts true

# ensure that they are not cleared at the end of the event
/vis/scene/endOfEventAction accumulate
There are many other visualization commands that can be added here as
well. Consult the Geant4
documentation for more
information. This section is also where you can put any other
application-specific commands. Next, start the simulation with
/run/beamOn followed by the number of primaries to generate. For
visualization purposes, you should not be generating more than a handful
of events.
# specify the number of events and start the simulation
/run/beamOn 1
Finally, refresh the viewer to ensure that the events generated have been added.
/vis/viewer/flush
By default, the file will be saved in the working directory (as
G4Data0.heprep for HepRep files and g4_00.wrl for VRML files),
but it can easily be renamed from within the macro by issuing a shell
command.
/control/shell mv G4Data0.heprep /new/path/to/file.heprep
If you are using your local computer, you can even pipe the output file directly to GeViewer to have the application load the file automatically following the simulation.
/control/shell geviewer /new/path/to/file.heprep
Note that this will not work if you are running Geant4 on a remote
machine over ssh, as GeViewer cannot be run using X11 forwarding. If
that is your use case, you can download the resulting visualization file
to open on your local computer.
Viewing Files
Loading files
To load a file, click File > Open File… in the menu bar. This will open a dialog where you can select the file to load. Repeat this process to load multiple files simultaneously. To clear the currently loaded files, click Edit > Clear Viewer.
When a file is loaded, a list of checkboxes will appear in the components panel on the left, allowing individual components to be toggled on or off. For HepRep files, this list will include all individual detector components and events in a hierarchy as defined in Geant4. Components with identical names, or components with the same names up to a numerical suffix, will be grouped together. This is necessary to show larger geometries containing too many components to render individually while maintaining performance (e.g. a detector with 100,000 identical SiPMs). For VRML files, the list will contain three components: the geometry, the trajectories, and the step markers. Each of these can only be toggled on or off as a whole.
Clicking a checkbox will toggle the visibility of the corresponding component and all of its children. By working from the top of the hierarchy downwards, and combination of visibilities can be achieved.
Interacting with the viewer
Most of the interactive controls should be intuitive, but a brief summary is provided below:
To rotate the view, click and drag
To zoom in and out, scroll or right click and drag
To pan, shift + click or click the scroll wheel and drag
To roll, ctrl + click and drag on Windows or command + click and drag on Mac and Linux
Toolbar view options
The toolbar provides a number of additional options for customizing the view. These include: * Toggling between wireframe and solid rendering modes
Toggling between opaque and transparent rendering modes. As HepRep files do not contain transparency information, this will affect all components simultaneously. For VRML files, which do contain transparency information, this will scale the transparency of all components uniformly.
Toggling between perspective and parallel projection modes. Perspective projection appears most natural and is therefore the default. For a true compoarison of object sizes independent of distance, however, parallel projection may be more useful.
Switching to common views, including:
Isometric view
Top view
Bottom view
Left view
Right view
Front view
Back view
Customizing the background
The default background is a gradient from light sky blue to navy blue. Under the View menu, both of these colors can be changed, the gradient can be turned on or off, and the background can be reset to the default.
View Options
Camera view parameters
While the camera view can be set completely using the mouse, more precise control can be achieved using the text fields in the Options tab of the control panel. Each of the following are set with vectors of three floating-point numbers, representing \(x\), \(y\), and \(z\):
Camera position: The position of the camera in world coordinates.
Camera focal point: The point in world coordinates that the camera is looking at.
Camera up vector: The direction in world coordinates that is considered “up” for the camera.
These text fields will be continually updated as the view is manipulated, allowing the user to use the view parameters displayed as a reference when setting them manually.
Event viewer
When a file is loaded, all events are shown simultaneously. To view an individual event, the spin box on the Options tab of the control panel can be used. This will turn off all other trajectories and trajectory step points, leaving only the selected event visible. Clicking the arrow buttons on the spin box, or using the arrow keys on your keyboard with the spin box selected, will cycle through the events.
Exporting figures
At any time, the current view can be exported by clicking the Export
Figure button on the Options tab of the control panel. Any of the
following file formats are supported: .png, .jpeg, .jpg,
.bmp, .tif, .tiff, .svg, .eps, .ps, .pdf,
.tex. When exporting a figure, the figure size in pixels can be set
by providing the width and height in the Figure size text field. The
default figure size is 1920x1440 pixels, which corresponds to a 6.4 inch
by 4.8 inch figure at 300 dpi.
Geometry Tools
Overlap inspector
The Tools tab on the control panel contains the overlap inspector and a measurement tool. The overlap inspector can be used to check for overlaps between detector components, will a few essential caveats:
If a component is contained entirely within another, the overlap will not be reported.
If a component’s mesh is not closed, it cannot be checked for overlaps. Meshes written to HepRep files by Geant4 occasionally have open edges. Small defects will be repaired when a file is loaded into GeViewer, but larger openings cannot be fixed. These components will be skipped during overlap checking.
The overlap inspector checks for overlaps in the meshes as produced by Geant4, which may not reflect the true geometry defined by the user. When a mesh is exported from Geant4, smooth surfaces are approximated with many discrete faces. This may introduce spurious overlaps, as demonstrated in the figure below.
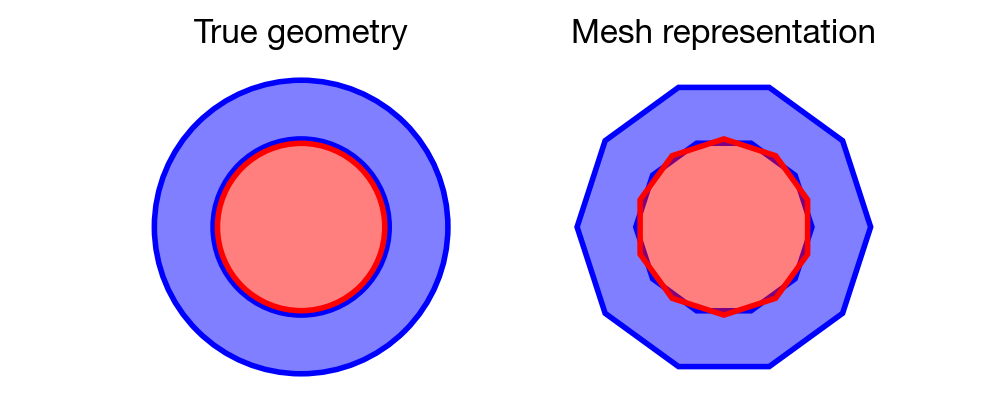
Spurious overlaps resulting from mesh approximation
The overlap inspector works by iterating through all possible pairs of components and checking each pair for overlaps. The overlap checking is done first by determining if the bounding boxes overlap. If they do, a set of sample points is generated within one of the bounding boxes. The number of points is set by the text field in the Tools tab of the control panel. The subset of these points that falls inside the mesh are then kept, while the others are thrown out. The surviving points, which approximate the solid body of one of the meshes, are then checked to determine if any fall inside the other mesh. If they do, the overlap will be reported and the points in the overlapping region will be shown in red, with all but the overlapping components hidden to highlight the location of the overlap.
If the file includes many identical components which have been grouped together during loading, these will have to be individually checked for overlaps with all other components. This has the potential to be a very time-consuming operation for large arrays of identical components (e.g. thousands of SiPMs), so use good judgement when selecting which components to include in overlap checking.
Measurement tool
The Measurement Tool, on the Tools tab of the control panel, can be used to measure the distance between any two points. To use the tool, click Add measurement, then click two points in the viewer to measure the distance between them. The measurement will be shown on the viewer and will also be reported in the text field in the Tools tab. Up to three distance measurements will be shown in the Tools tab at a time. As new measurements are added, the oldest will be removed to keep the total number of measurements displayed at three.
Additional Options
Saving files
HepRep files that are particularly large (>1 GB) can take a minute or
more to parse and load. Fortunately, this step needs to be done only
once. After a file is loaded, it can be saved in a more convenient
format for much faster loading in the future. With a file open, click
File > Save As… in the menu bar. This will open a dialog allowing
for a destination file path to be provided. The file must be saved with
the .gev extension in order for GeViewer to recognize it. GeViewer
sessions with multiple open files can similarly be saved and loaded.
File converter utility
The file parsing and loading steps can be called from the command line,
or from within a Geant4 macro, to avoid the need to manually start the
process when GeViewer is launched. This is done using the
gev-converter command line utility, which is installed automatically
along with GeViewer. To use the utility, call it with the path to a file
to be converted and the path to a destination file with the .gev
extension.
gev-converter /path/to/file.heprep /path/to/file.gev
This command can be issued from within a Geant4 macro:
/control/shell gev-converter G4Data0.heprep /path/to/file.gev
The gev-converter utility does not have an interactive component and
can therefore be run on a remote machine over ssh.
Other options
Depth peeling is a technique for rendering transparent objects. It is disabled by default as it often slows down rendering. To enable depth peeling, click the View > Use Depth Peeling menu item.
Most operations in GeViewer will be reported in the console on the control panel, as will any errors or warnings. The console can be cleared by clicking Edit > Clear Console, and the contents of the console can be copied to the clipboard by clicking Edit > Copy Console.
Operations can be aborted by clicking Edit > Abort Process. This can be useful if, for example, you start checking for overlaps without unselecting a component with many subcomponents. Needless to say, this should be done sparingly.